Analytics · 5 min read · July 6, 2026
Why Your Marketing Report Shows Nothing — And What to Upload Instead
If your briefing comes back empty, the most likely reason is a short data window — not flat marketing. Here's how to choose the right export range to surface slow trends that 7-day uploads miss.
Why Your Marketing Report Shows Nothing — And What to Upload Instead
You uploaded your data, ran the briefing, and got back... nothing. No changes detected. No signals. Just a blank slate.
Before you assume your marketing is perfectly flat, consider a more likely explanation: the window of data you uploaded is too short to catch what's actually happening.
The difference between a spike and a slide
There are two very different kinds of problems in marketing data. The first kind is sudden — a spike in ad spend, a traffic crash overnight, a conversion rate that drops by half in 48 hours. These show up clearly in a 7- or 14-day export because the change is sharp enough to stand out against recent history.
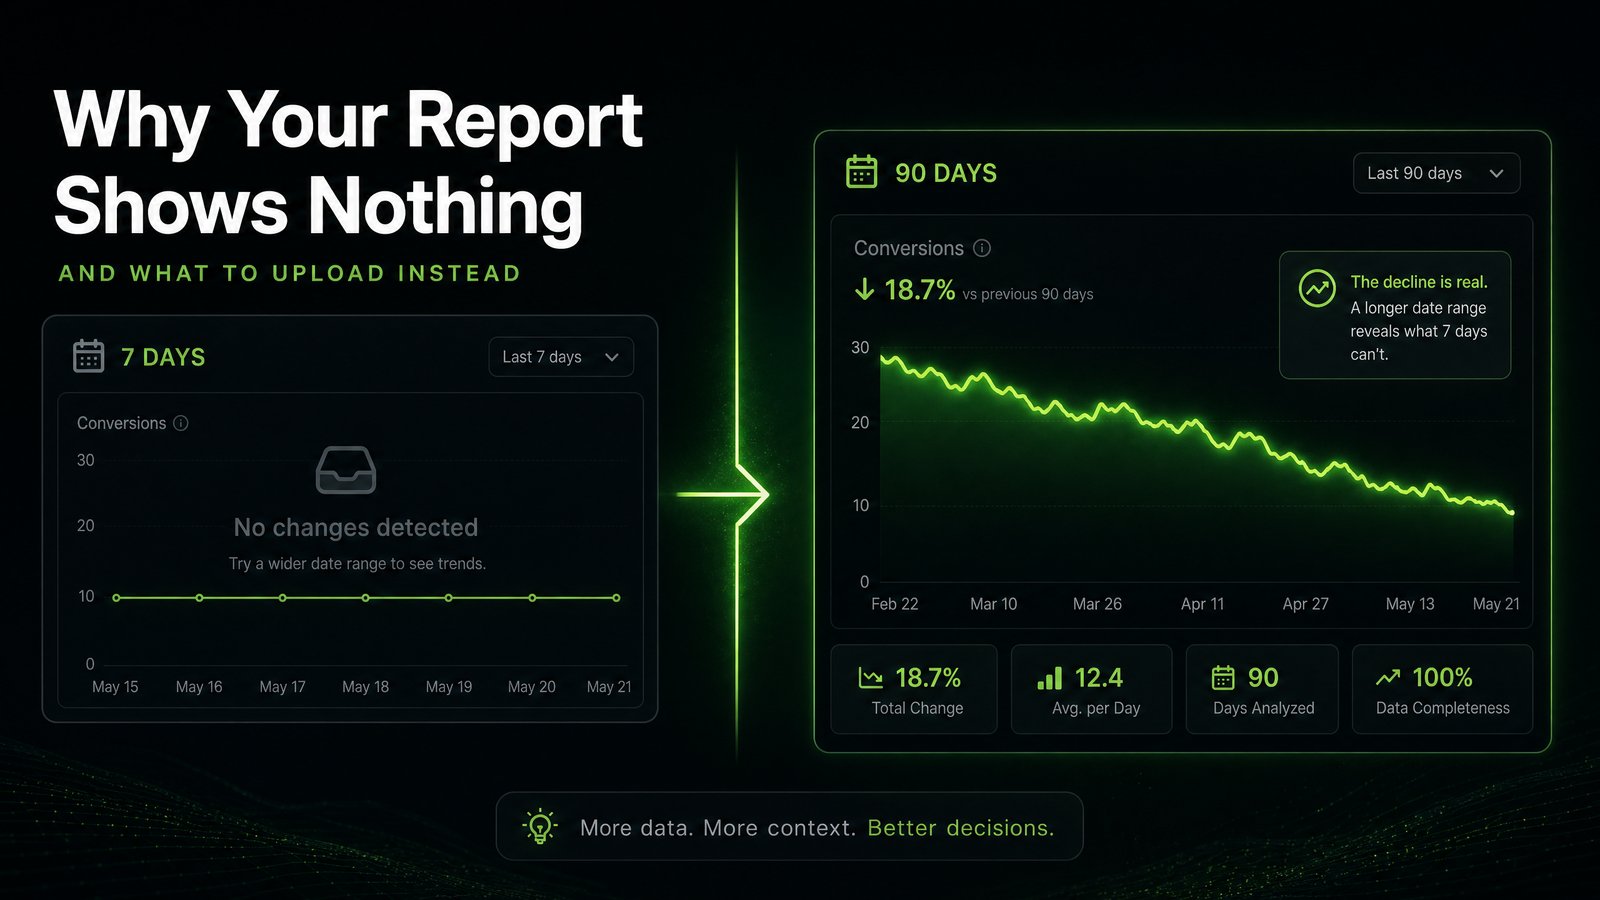
The second kind is slow. A channel that's been quietly losing ground for eight weeks. An email list that's been shrinking at 2% per month. A product category whose average order value has been drifting down since the beginning of the quarter. None of these show up in a short window because there's no single dramatic moment — just a gradual slope that only becomes visible when you zoom out far enough.
If your report shows nothing, it's often because you uploaded a 7-day or 14-day file, and the problem you're dealing with is the slow kind.
What "data window" means in practice
When you export data from Shopify, Google Analytics, Meta Ads, or any other platform, you choose a date range. That range is your data window. The briefing engine looks at what changed within that window — so if the window is only two weeks, it can only compare this week to last week.
A two-week window is excellent for catching sudden changes. It is nearly useless for catching gradual trends, because the baseline and the current period are both inside the same short stretch of time. There's no long-term context to compare against.
A 60- to 90-day window gives the engine enough history to distinguish between normal week-to-week variation and a genuine multi-week trend. The difference in what gets surfaced is significant.
A practical guide to choosing your window
The right window depends on what you're trying to catch:
| What you want to detect | Recommended window |
|---|---|
| Sudden spikes or crashes | 7–14 days |
| Week-over-week patterns | 21–30 days |
| Monthly trend shifts | 60 days |
| Slow multi-month declines | 90 days |
| Seasonal comparisons | 365 days (or year-over-year export) |
For most founders and marketing managers running a weekly briefing, 60 days is the sweet spot. It's long enough to catch slow trends, short enough that the data is still recent and actionable.
How to export more history from common platforms
Shopify: In your Shopify admin, go to Analytics → Reports. Most reports let you set a custom date range — select the last 60 or 90 days, then export as CSV.
Google Analytics 4 (GA4): In Explorations or standard reports, set the date range to the last 90 days. Use the export icon in the top right to download as CSV.
Meta Ads Manager: In the date picker, choose "Last 90 days" or set a custom range. Click the download icon to export the current view.
Mailchimp: In Audience → Audience dashboard, you can export subscriber activity or campaign performance. Set the filter to cover the last 60–90 days before exporting.
HubSpot: In Reports → Analytics Tools, use the date range filter and export the table view. The default is often 30 days — change it to 90 before exporting.
What happens when you upload a longer window
When you upload 60–90 days of data instead of 7–14 days, the briefing engine has more context to work with. It can:
- Identify whether a current dip is a one-week blip or part of a longer downward trend
- Surface channels that have been slowly losing efficiency over multiple weeks
- Distinguish between seasonal patterns and genuine performance shifts
- Flag metrics that are declining slowly but consistently — the kind of problem that's easy to miss until it becomes serious
The briefing you receive will be more specific, and the recommended actions will be more grounded in what's actually happening over time rather than just the last few days.
One more thing: you don't need to re-upload everything every week
Once you've uploaded a 90-day baseline, you don't need to repeat that every time. For your weekly briefing, you can upload just the most recent 14 days — the engine will use the longer history you already have as context.
The key is to do the longer upload at least once when you first set up your briefing, or whenever you suspect a slow trend that your weekly exports aren't catching.
If your report is showing nothing and your marketing doesn't feel flat, the answer is almost always more history. Export 60–90 days, upload it once, and let the briefing tell you what's been quietly happening in the background.
Need a hand getting the longer export out? Follow our step-by-step upload guides for Meta Ads and Google Analytics 4.