Social Media · 15 min read · May 19, 2026
The Complete Guide to X (Twitter) Analytics for Brands
Everything brands need to measure on X — Twitter statistics for business, audience insights vs. analytics, ads analytics, how to measure influence on Twitter, and the share of voice formula with worked examples.
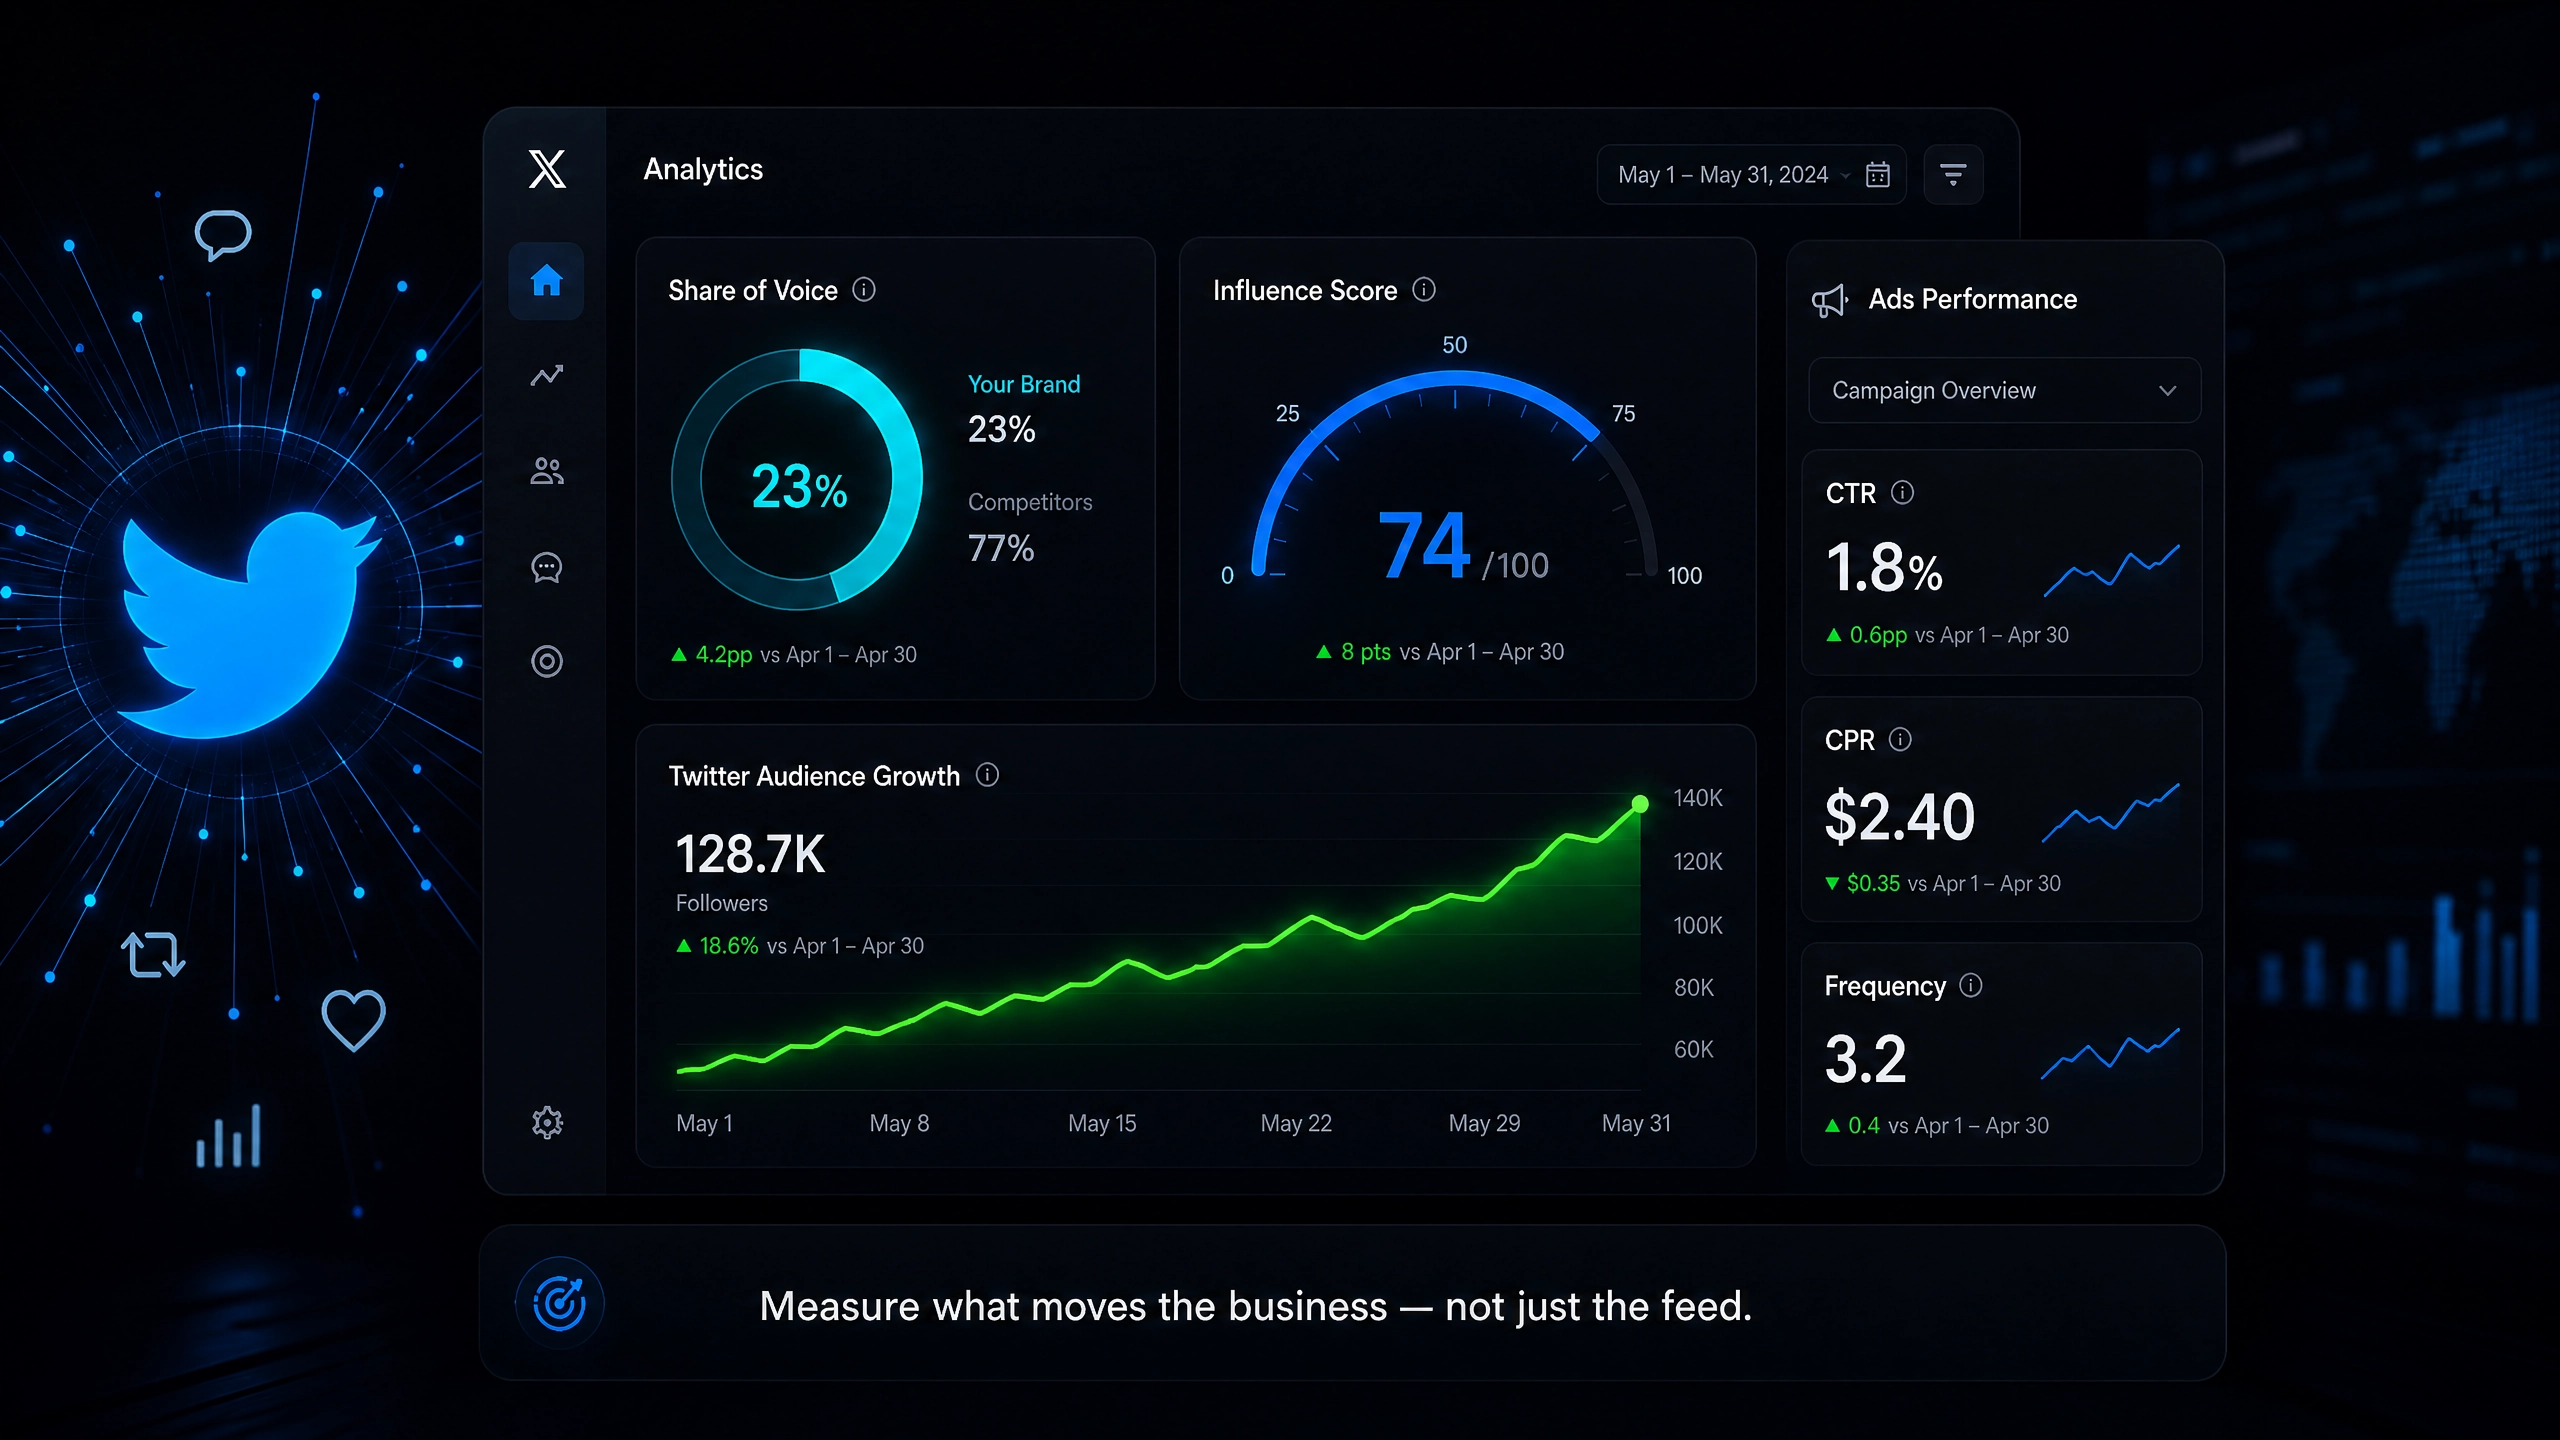
The Complete Guide to X (Twitter) Analytics for Brands
X (formerly Twitter) generates more real-time business signal than almost any other platform — but most brands extract only a fraction of it. They track likes and follower counts, run a monthly report, and move on. The result is a strategy built on vanity metrics that feels busy but tells you nothing about whether your brand is actually growing, losing ground, or wasting budget.
This guide covers the full measurement stack for X analytics for business: what Twitter statistics for business actually matter, how to read audience insights versus raw analytics, how to interpret Twitter ads analytics without a data science background, how to build a repeatable methodology for measuring influence on Twitter, and how to apply the share of voice formula to benchmark your brand against the market. Each section includes the metric definition, the calculation, and the decision it should inform.
Why Most Brands Measure the Wrong Things on X
The default X analytics dashboard surfaces impressions, engagements, and follower counts. These numbers are easy to read and easy to report, which is precisely why they dominate most social media reviews. The problem is that none of them answer the question a business leader actually cares about: is our presence on X making the business stronger?
Impressions measure how many times a post appeared in a feed — not whether anyone read it. Engagements measure clicks, likes, and replies — not whether any of those interactions led to a sale, a sign-up, or a shift in brand perception. Follower count measures the size of an audience — not its quality, its intent, or its likelihood to buy.
The shift required is from activity metrics to outcome metrics. The five areas covered in this guide — business statistics, audience insights, ads analytics, influence measurement, and share of voice — are all outcome-oriented. They connect what happens on X to what happens in the business.
Part 1: Twitter Statistics for Business — The Metrics That Actually Matter
When marketers talk about Twitter statistics for business, they typically mean the set of platform metrics that have a demonstrable relationship with commercial outcomes. The list is shorter than most people expect.
Link Click Rate
Link click rate is the percentage of people who saw a post and clicked the link in it. It is calculated as link clicks divided by impressions, multiplied by 100. A post with 10,000 impressions and 150 link clicks has a link click rate of 1.5%. This metric matters because it is the bridge between social activity and website behaviour — the only point at which an X interaction becomes a measurable business event.
Benchmarks vary by industry and content type, but organic posts on X typically achieve link click rates between 0.5% and 2%. Posts that exceed 2% are performing exceptionally well and are worth analysing for patterns in format, timing, and copy.
Profile Visit Rate
Profile visits measure how many users clicked through to your brand's X profile after seeing a post or being mentioned. A high profile visit rate relative to impressions suggests that the content is generating genuine curiosity — people want to know more about who is behind the post. This is a leading indicator of follower growth and brand interest that precedes any formal conversion.
Engagement Rate (Calculated Correctly)
The standard engagement rate reported in X analytics divides total engagements by impressions. A more useful calculation for business purposes divides engagements by reach (unique accounts reached), which removes the distortion caused by the same account seeing a post multiple times. For most brands, a reach-based engagement rate above 3% indicates content that is genuinely resonating with the audience that sees it.
Follower Growth Rate (Not Count)
Raw follower count is a vanity metric. Follower growth rate — the percentage change in followers over a defined period — is a business metric. A brand with 5,000 followers growing at 8% per month is outperforming a brand with 50,000 followers growing at 0.3% per month in terms of momentum and trajectory. Calculate it as: (followers at end of period − followers at start of period) ÷ followers at start of period × 100.
Reply Sentiment Ratio
The ratio of positive to negative replies on a post is a qualitative signal that most analytics tools ignore but that carries significant brand health information. A product announcement that generates 200 replies, 80% of which are negative, is a crisis signal regardless of how high the engagement rate looks in a dashboard. Monitoring reply sentiment alongside quantitative metrics gives a more complete picture of how the brand is being received.
| Metric | What It Measures | Business Decision It Informs |
|---|---|---|
| Link click rate | Content-to-website conversion | Which posts to boost or replicate |
| Profile visit rate | Brand curiosity generated | Top-of-funnel interest level |
| Engagement rate (reach-based) | Content resonance with actual viewers | Content format and topic optimisation |
| Follower growth rate | Audience momentum | Whether current strategy is building reach |
| Reply sentiment ratio | Brand perception quality | Reputation management and crisis detection |
Part 2: Twitter Audience Insights vs. Twitter Analytics — Understanding the Difference
These two terms are often used interchangeably, but they describe different layers of data. Understanding the distinction changes how you use each one.
What Twitter Analytics Tells You
Twitter analytics (accessed via analytics.twitter.com or the X Pro dashboard) is post-level and account-level performance data. It tells you what happened: how many impressions a post received, how many people clicked, how many new followers you gained this month, which posts drove the most profile visits. It is backward-looking, descriptive, and specific to your own account's activity.
The native analytics dashboard provides 28-day summaries, top tweet performance, and a monthly comparison view. For most brands, this is the starting point — but it is not sufficient for strategic decision-making on its own because it only shows your own data in isolation.
What Twitter Audience Insights Tells You
Twitter audience insights goes one layer deeper. Rather than describing what your posts did, it describes who your audience is: their interests, their demographics, the other accounts they follow, the devices they use, and — where available — their purchasing behaviour and household income brackets. This data was historically available through the Twitter Audience Insights tool within the Ads Manager, though its availability has changed with the platform's evolution under X.
The strategic value of audience insights is in the gap between who you think your audience is and who it actually is. A B2B software brand that assumes its X audience is primarily CTOs may discover through audience insights that the majority of its engaged followers are actually mid-level developers and product managers — a finding that should reshape both content strategy and ad targeting.
How to Use Both Together
The most effective approach treats analytics and audience insights as complementary layers. Use analytics to identify your top-performing posts. Then use audience insights to understand which audience segments are driving that performance. If your highest-engagement posts are being driven by a demographic you were not deliberately targeting, that is both a content opportunity and a potential ad targeting refinement. The combination answers not just what worked but who it worked for — which is the question that actually improves strategy.
Part 3: Twitter Ads Analytics — Reading Campaign Data Without a Data Science Background
Twitter ads analytics is the performance layer for paid activity on X. It lives inside the X Ads Manager and tracks every metric from impression delivery through to conversion, broken down by campaign, ad group, and individual creative. The challenge for most marketing teams is not accessing the data — it is knowing which numbers to prioritise and what they are actually telling you.
The Four Metrics That Determine Campaign Health
Cost per result (CPR) is the single most important number in any X ads campaign. It tells you how much you are paying for each outcome the campaign was designed to produce — whether that is a website click, a video view, a follower, or a conversion. CPR should be tracked against a benchmark (either historical performance or industry average) and should trend downward over time as targeting and creative are refined.
Click-through rate (CTR) measures the percentage of people who saw the ad and clicked it. A low CTR on a well-targeted campaign usually indicates a creative problem — the copy or visual is not compelling enough to interrupt the scroll. A high CTR with a low conversion rate on the destination page indicates a landing page problem. CTR is the diagnostic that tells you where in the funnel the friction is.
Frequency measures how many times the average person in your target audience has seen the ad. Frequency above 5–7 in a short campaign window typically signals audience fatigue — the same people are seeing the same creative repeatedly, which drives up CPR and drives down CTR. When frequency rises, the fix is either to expand the audience or refresh the creative.
Conversion rate is the percentage of ad clicks that result in the desired action on your website. This metric lives at the intersection of your X campaign and your website, which is why it requires UTM parameters and proper analytics integration to track accurately. A conversion rate below 1% on a direct-response campaign usually indicates a mismatch between the ad's promise and the landing page's delivery.
Exporting and Analysing X Ads Data
The X Ads Manager allows campaign data to be exported as CSV from the reporting section. When exporting, select a date range of at least 30 days to smooth out day-of-week variation, and include all available columns — particularly spend, impressions, clicks, conversions, and CPR. Once exported, the data can be uploaded to a briefing tool or analytics platform to identify trends that are not visible in the native dashboard's 7-day default view.
| Metric | What It Diagnoses | When to Act |
|---|---|---|
| Cost per result (CPR) | Overall campaign efficiency | Rising CPR → refresh creative or narrow targeting |
| Click-through rate (CTR) | Creative effectiveness | CTR below 0.5% → new ad copy or visual |
| Frequency | Audience fatigue | Frequency above 6 → expand audience or pause |
| Conversion rate | Landing page alignment | Below 1% → audit landing page message match |
Part 4: How to Measure Influence on Twitter — A Repeatable Methodology
Measuring influence on Twitter is one of the most misunderstood tasks in social media analytics. Most guides reduce it to a list of tools — Followerwonk, Brandwatch, SparkToro — without explaining what influence actually is or how to measure it in a way that is consistent, repeatable, and tied to business outcomes.
Influence on X is not a single number. It is a composite of four distinct dimensions: reach, resonance, relevance, and authority. Each dimension requires a different measurement approach, and the combination produces a picture of influence that is far more useful than any single score.
Dimension 1 — Reach
Reach is the potential size of the audience that could see your content. On X, it is not simply your follower count — it is the sum of your followers' followers, weighted by the likelihood that they will retweet or quote-post your content. A more practical proxy for reach is average impressions per post over a rolling 30-day period. This number accounts for algorithmic distribution and retweet amplification in a way that raw follower count does not.
To calculate it: export your last 30 days of post data from X analytics, sum the impressions column, and divide by the number of posts published. Compare this figure month-over-month. A rising average impressions per post indicates growing reach even if follower count is flat — the algorithm is distributing your content more broadly.
Dimension 2 — Resonance
Resonance measures whether your content generates a response that extends beyond the initial impression. The best proxy for resonance is retweet and quote-post rate — the percentage of people who saw a post and chose to share it with their own audience. This is a high-intent signal: sharing requires a deliberate action and implies that the sharer believes the content is worth their own audience's attention.
Calculate retweet rate as: (retweets + quote posts) ÷ impressions × 100. A rate above 0.5% is strong for organic content. Posts with retweet rates above 1% are genuinely resonant and should be analysed for the content patterns that drove the response.
Dimension 3 — Relevance
Relevance measures whether your influence is concentrated in the right conversations. A brand can have high reach and resonance in conversations that are entirely unrelated to its business — a viral post about a trending topic, for example. Relevance asks: what percentage of your mentions, replies, and retweets occur in conversations that are topically aligned with your brand's domain?
Measuring relevance requires social listening rather than native X analytics. Track mentions of your brand alongside the keywords and hashtags that define your industry. Calculate the percentage of brand mentions that occur within those topically relevant conversations. A brand with 70% topically relevant mentions has stronger influence in its actual market than a brand with 90% reach but only 20% topical relevance.
Dimension 4 — Authority
Authority is the hardest dimension to quantify but the most durable form of influence. It is measured by the quality of accounts that engage with and amplify your content. A retweet from an account with 500,000 followers in your industry carries more authority signal than 50 retweets from accounts with 200 followers each.
A practical proxy for authority is influential amplifier rate: the percentage of your retweets and mentions that come from accounts with more than 10,000 followers in your industry vertical. Track this monthly. A rising influential amplifier rate means your brand is increasingly being endorsed by voices that carry weight in your market.
Building a Composite Influence Score
Combining these four dimensions into a composite score requires weighting each one according to your business priorities. A brand focused on broad awareness might weight reach and resonance more heavily. A B2B brand focused on industry credibility might weight relevance and authority more heavily. A simple approach is to score each dimension on a 1–10 scale based on benchmarks, then calculate a weighted average. The resulting score is less important than the trend — is your influence score rising or falling month-over-month, and which dimension is driving the change?
| Dimension | Metric | How to Calculate |
|---|---|---|
| Reach | Avg. impressions per post (30-day) | Sum of impressions ÷ posts published |
| Resonance | Retweet + quote-post rate | (Retweets + QPs) ÷ impressions × 100 |
| Relevance | Topically relevant mention % | Industry mentions ÷ total mentions × 100 |
| Authority | Influential amplifier rate | High-follower amplifiers ÷ total amplifiers × 100 |
Part 5: Share of Voice on X — The Formula and How to Apply It
Share of voice (SoV) is the metric that places your brand's X presence in competitive context. It answers the question: out of all the conversation happening in your market on X, what percentage of it involves your brand? A brand with a high share of voice is dominating the conversation in its category. A brand with a low and declining share of voice is being crowded out by competitors.
The Share of Voice Formula
The standard share of voice formula is:
Share of Voice = (Brand Mentions ÷ Total Market Mentions) × 100
Where "brand mentions" is the number of times your brand name, handle, and key branded hashtags were mentioned on X in a given period, and "total market mentions" is the sum of mentions for your brand and all direct competitors combined.
For example: if your brand received 1,200 mentions in a month, and the combined mentions for all brands in your competitive set totalled 8,400, your share of voice is (1,200 ÷ 8,400) × 100 = 14.3%.
Defining Your Competitive Set
The accuracy of your SoV calculation depends entirely on how you define the competitive set. Too narrow a set (only your two closest competitors) will inflate your SoV. Too broad a set (every brand that tangentially competes with you) will deflate it. The right approach is to define the competitive set as the brands a customer would seriously consider as alternatives to yours — typically three to six brands depending on the market.
Once the competitive set is defined, it should remain consistent across measurement periods so that changes in SoV reflect genuine shifts in conversation volume rather than changes in methodology.
Measuring SoV in Practice
Native X analytics does not provide competitive mention data, so measuring SoV requires a social listening tool. Options range from enterprise platforms (Brandwatch, Sprinklr, Talkwalker) to mid-market tools (Mention, Brand24, Keyhole) to free options (TweetDeck saved searches, Google Alerts for brand names). The choice of tool determines the accuracy and completeness of the mention data, but even an imperfect SoV measurement is more useful than no competitive context at all.
Export mention data for your brand and each competitor over the same time period, sum the totals, and apply the formula. Track SoV monthly and plot it as a trend line. A rising SoV indicates that your brand is capturing a larger share of market conversation — either because your own mentions are growing or because a competitor's mentions are declining.
Share of Voice by Sentiment
A more sophisticated version of SoV analysis segments mentions by sentiment — positive, neutral, and negative. This produces a positive share of voice metric: the percentage of positive market conversation that your brand owns. A brand can have a high overall SoV driven by negative mentions (a PR crisis, for example) while having a low positive SoV. Tracking both dimensions gives a more accurate picture of brand health than volume alone.
Using SoV to Set Content Strategy
Share of voice data is most actionable when it is tracked alongside content output. If your SoV rises in weeks when you publish thought leadership content and falls in weeks when you publish only promotional content, that is a clear signal about what type of content drives market conversation. If a competitor's SoV spikes, analyse what they published or did during that period — a product launch, a campaign, a controversy — to understand what is driving the shift and whether a response is warranted.
Part 6: Connecting X Analytics to Business Outcomes
The five measurement areas covered above — business statistics, audience insights, ads analytics, influence, and share of voice — are most valuable when they are read together rather than in isolation. A brand that is growing its share of voice but declining in link click rate is building awareness without converting it. A brand with strong ads analytics but a falling influence score is buying attention rather than earning it. A brand with high audience insight alignment but low engagement rate has the right audience but the wrong content.
Building a Monthly X Performance Review
A practical monthly review should cover six data points: link click rate trend, follower growth rate, top-performing post (and why it worked), share of voice vs. prior month, cost per result for any active paid campaigns, and one audience insight finding. This review takes 30–45 minutes with the right data exported and should produce one content decision, one targeting decision, and one budget decision for the following month.
Automating the Data Collection
The most common reason brands do not run this kind of analysis is the time required to export, clean, and interpret data from multiple sources. Exporting X analytics, ads data, and social listening data separately and combining them manually is a 2–3 hour task that most teams deprioritise. Tools that accept CSV exports from X and surface the key signals automatically — trend changes, anomalies, share of voice shifts — reduce this to a few minutes and make consistent monthly analysis feasible for teams without dedicated data analysts.
Frequently Asked Questions
What is the difference between Twitter analytics and Twitter audience insights?
Twitter analytics (now X analytics) shows post-level and account-level performance data — impressions, engagements, link clicks, and follower changes for your own account. Twitter audience insights describes who your audience is — their demographics, interests, and behaviours. Analytics tells you what happened; audience insights tells you who drove it.
How do I measure influence on Twitter?
Influence on Twitter is best measured across four dimensions: reach (average impressions per post), resonance (retweet and quote-post rate), relevance (percentage of mentions in topically aligned conversations), and authority (percentage of amplifications from high-follower accounts in your industry). Tracking all four monthly produces a more reliable picture of influence than any single score or tool.
What is the share of voice formula for Twitter?
Share of voice = (your brand mentions ÷ total mentions for all brands in your competitive set) × 100. Measure it over a consistent time period (monthly is standard), keep the competitive set fixed, and track it as a trend rather than a point-in-time snapshot.
Which Twitter statistics matter most for business?
The five that have the clearest relationship with business outcomes are: link click rate, profile visit rate, engagement rate calculated on reach (not impressions), follower growth rate, and reply sentiment ratio. These connect social activity to website behaviour, brand interest, content quality, audience momentum, and brand perception respectively.
How do I read Twitter ads analytics?
Focus on four metrics: cost per result (the primary health indicator), click-through rate (the creative diagnostic), frequency (the audience fatigue indicator), and conversion rate (the landing page diagnostic). Export campaign data as CSV from the X Ads Manager for periods of at least 30 days to identify trends that the native dashboard's default 7-day view obscures.
Measuring X alongside your other channels? The free Marketing Pulse Score Calculator scores your overall marketing health from 0–100 in minutes — no signup required. And when you upload your X analytics CSV export to DawnPulse, you get anomaly detection and an AI-powered daily briefing across every channel you track. Start your 14-day free Pro trial — no credit card required.