Sales · 8 min read · May 19, 2026
10 KPIs Every E-commerce Store Must Track (And What They Actually Mean)
From Average Order Value to Customer Lifetime Value, this curated list breaks down the 10 metrics that separate growing stores from stagnant ones — with benchmarks for each.
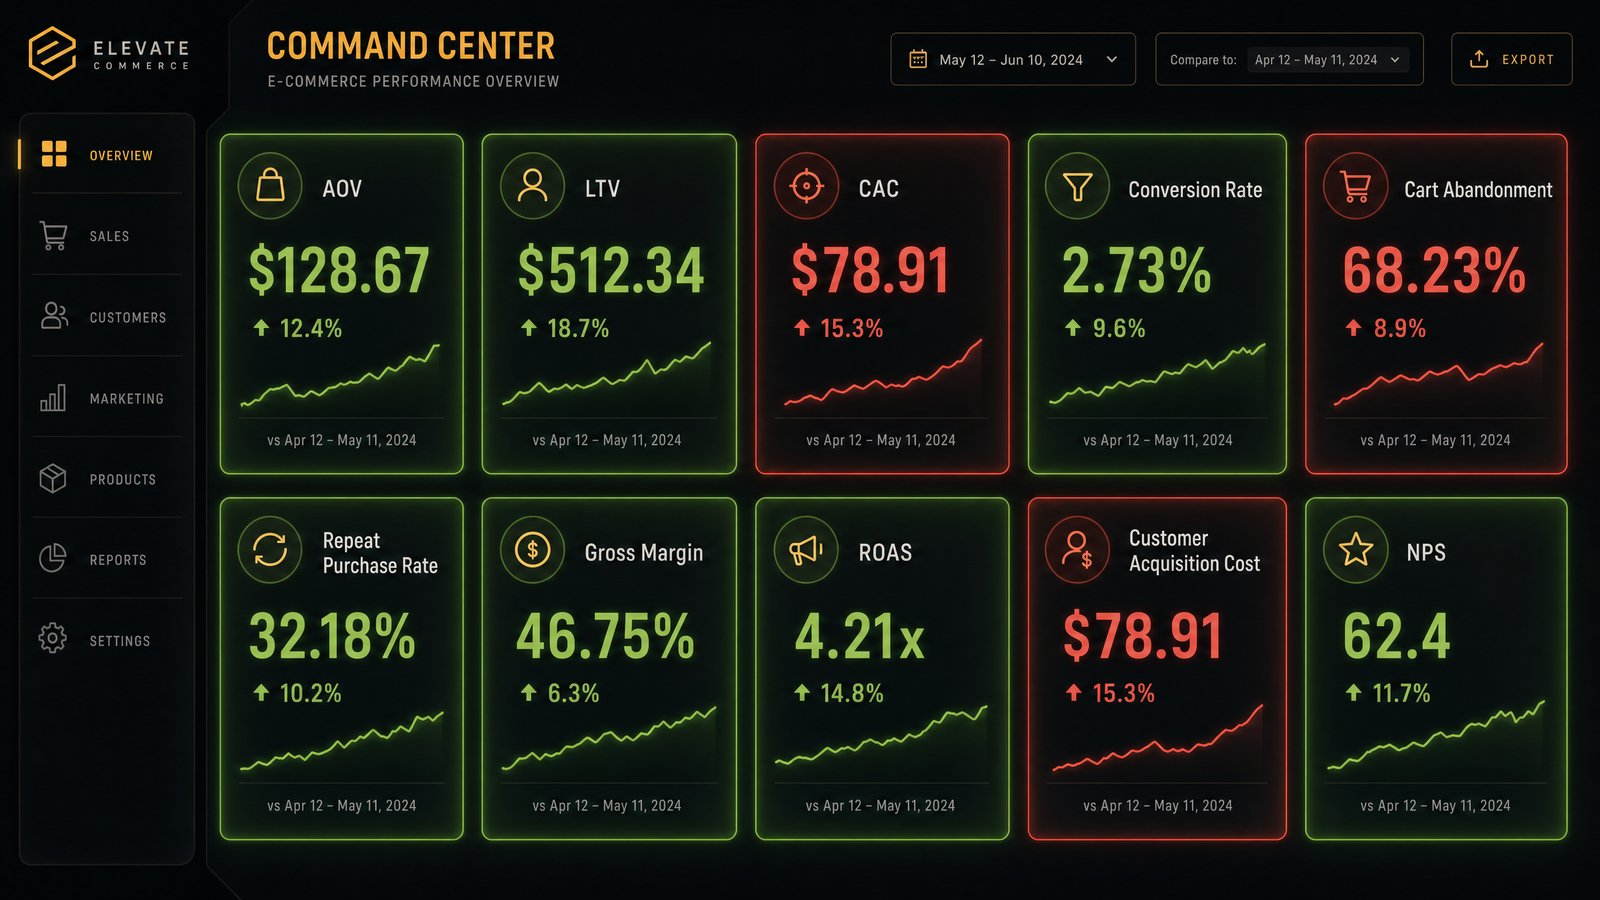
10 KPIs Every E-commerce Store Must Track (And What They Actually Mean)
In the dynamic world of e-commerce, understanding the pulse of your business is paramount to sustained growth and profitability. With countless data points available, discerning which metrics truly matter can be a daunting task. This comprehensive guide cuts through the noise, presenting the 10 KPIs every e-commerce store must track to not only monitor performance but also to strategically steer their operations. These key performance indicators offer deep insights into customer behavior, marketing effectiveness, operational efficiency, and overall financial health, providing the clarity needed to transform raw data into actionable intelligence. By focusing on these essential metrics, businesses can identify opportunities, mitigate risks, and ensure they are on a trajectory for success.
1. Average Order Value (AOV)
What it means: Average Order Value (AOV) represents the average amount of money a customer spends per transaction on your website. It's calculated by dividing your total revenue by the number of orders placed over a specific period. A higher AOV indicates that customers are purchasing more items or more expensive items each time they shop.
Why it's important: Increasing AOV is a powerful strategy for boosting revenue without necessarily increasing website traffic or conversion rates. It reflects the effectiveness of upselling, cross-selling, and bundling strategies. Understanding your AOV helps in optimizing pricing, product recommendations, and promotional offers.
Benchmarks: AOV varies significantly by industry, product type, and target audience. For many e-commerce businesses, an AOV between $50 and $150 is common, but luxury goods or specialized niches can see much higher figures. The key is to track your own trend and compare it against industry averages relevant to your specific market.
2. Conversion Rate (CR)
What it means: Conversion Rate (CR) is the percentage of website visitors who complete a desired action, typically making a purchase. It's calculated by dividing the number of conversions (purchases) by the total number of website visitors and multiplying by 100.
Why it's important: CR is a direct indicator of your website's effectiveness in turning browsers into buyers. A strong conversion rate suggests that your product offerings, pricing, website design, user experience, and marketing messages are resonating with your audience. Optimizing CR can significantly impact revenue without additional marketing spend.
Benchmarks: E-commerce conversion rates typically range from 1% to 4%, with some industries or highly optimized stores achieving higher. Factors like product type, price point, traffic source, and device used can influence this metric. Consistent improvement, even by small percentages, can lead to substantial gains.
3. Customer Acquisition Cost (CAC)
What it means: Customer Acquisition Cost (CAC) is the total expense incurred to acquire a new customer. This includes all marketing and sales expenses (advertising, salaries, commissions, overheads) divided by the number of new customers acquired over the same period.
Why it's important: CAC is crucial for assessing the profitability of your marketing efforts. If your CAC is too high relative to the revenue a customer generates, your business model may not be sustainable. It helps in evaluating the efficiency of different marketing channels and campaigns.
Benchmarks: CAC varies widely depending on the industry, product price, and marketing channels. For e-commerce, it's vital to compare CAC against Customer Lifetime Value (CLTV) to ensure long-term profitability. A healthy ratio often sees CLTV at least three times higher than CAC.
4. Customer Lifetime Value (CLTV)
What it means: Customer Lifetime Value (CLTV) is the predicted total revenue that a business can expect to generate from a single customer account throughout their relationship with the company. It considers average purchase value, purchase frequency, and customer retention rate.
Why it's important: CLTV is a forward-looking metric that highlights the long-term value of your customer base. A high CLTV indicates strong customer loyalty and repeat business, which are cornerstones of sustainable growth. Understanding CLTV helps in making informed decisions about marketing spend, customer service, and product development.
Benchmarks: CLTV benchmarks are highly industry-specific. For subscription-based e-commerce, CLTV can be very high. For transactional e-commerce, it depends on repeat purchase behavior. The goal is always to maximize CLTV, often by enhancing customer experience and fostering loyalty programs.
5. Gross Profit Margin (GPM)
What it means: Gross Profit Margin (GPM) is the percentage of revenue left after deducting the cost of goods sold (COGS). It's calculated as (Revenue - COGS) / Revenue * 100. COGS includes the direct costs attributable to the production of the goods sold by a company.
Why it's important: GPM is a fundamental indicator of your business's financial health and pricing strategy. A healthy gross profit margin ensures that there's enough money left to cover operating expenses and generate net profit. It helps in evaluating product profitability and pricing effectiveness.
Benchmarks: GPM varies significantly by industry. For e-commerce, it can range from 20% to 60% or even higher, depending on the product type (e.g., digital products often have higher margins than physical goods). Monitoring GPM helps in identifying issues with sourcing, production costs, or pricing.
6. Return on Ad Spend (ROAS)
What it means: Return on Ad Spend (ROAS) measures the revenue generated for every dollar spent on advertising. It's calculated by dividing the total revenue attributed to advertising by the total advertising cost. For example, a ROAS of 4:1 means you earn $4 for every $1 spent on ads.
Why it's important: ROAS is a critical metric for evaluating the effectiveness of your advertising campaigns. It provides a clear picture of which campaigns, channels, or ad sets are generating the most revenue, allowing for optimization of your marketing budget and strategies. A strong ROAS is essential for profitable scaling.
Benchmarks: A good ROAS typically starts at 3:1 or 4:1, meaning you generate three or four times your ad spend in revenue. However, this can vary based on profit margins, industry, and business goals. Some businesses aim for a higher ROAS to cover other operational costs.
7. Website Traffic
What it means: Website Traffic refers to the number of visitors to your e-commerce store. This can be broken down into various segments, such as unique visitors, page views, and traffic sources (organic search, paid search, social media, direct, referral).
Why it's important: Traffic is the lifeblood of any e-commerce business. Without visitors, there are no potential customers. Analyzing traffic volume and sources helps in understanding the reach of your marketing efforts and identifying opportunities for growth. High-quality traffic is more valuable than sheer volume.
Benchmarks: Website traffic benchmarks are highly dependent on the size of the business, marketing budget, and industry. A small niche store might thrive on a few thousand highly targeted visitors per month, while a large retailer might need millions. The focus should be on consistent growth and the quality of traffic.
8. Cart Abandonment Rate
What it means: Cart Abandonment Rate is the percentage of customers who add items to their shopping cart but leave the website before completing the purchase. It's calculated by dividing the number of abandoned carts by the number of initiated carts and multiplying by 100.
Why it's important: A high cart abandonment rate indicates potential issues in your checkout process, shipping costs, payment options, or overall user experience. Addressing these issues can significantly increase your conversion rate and recover lost sales. It's a direct measure of friction in the final stages of the buying journey.
Benchmarks: The average cart abandonment rate for e-commerce typically ranges from 60% to 80%. While it's nearly impossible to achieve a 0% abandonment rate, continuous efforts to optimize the checkout flow, offer transparent pricing, and provide various payment options can help reduce this metric.
9. Repeat Purchase Rate (RPR)
What it means: Repeat Purchase Rate (RPR) is the percentage of customers who have made more than one purchase from your store over a given period. It's calculated by dividing the number of repeat customers by the total number of unique customers and multiplying by 100.
Why it's important: RPR is a strong indicator of customer loyalty and satisfaction. Acquiring new customers is often more expensive than retaining existing ones, so a high RPR signifies a healthy, sustainable business model. It reflects the effectiveness of your post-purchase experience, customer service, and loyalty programs.
Benchmarks: RPR varies widely by industry and product type. For many e-commerce businesses, an RPR between 20% and 40% is considered good, but subscription services or consumable goods can see much higher rates. Focusing on customer retention strategies can significantly boost this KPI.
10. Net Promoter Score (NPS)
What it means: Net Promoter Score (NPS) is a customer loyalty metric that measures the willingness of customers to recommend a company's products or services to others. It's based on a single survey question: "On a scale of 0 to 10, how likely are you to recommend [Company Name] to a friend or colleague?"
Why it's important: NPS provides a quick and effective way to gauge overall customer satisfaction and loyalty. It categorizes customers into Promoters (9-10), Passives (7-8), and Detractors (0-6). A high NPS indicates strong customer advocacy, which is invaluable for organic growth through word-of-mouth marketing.
Benchmarks: NPS benchmarks differ across industries. A score above 0 is generally considered good, above 30 is great, and above 50 is excellent. Continuously monitoring NPS and acting on feedback from Detractors and Passives can lead to significant improvements in customer experience and loyalty.
Conclusion
Mastering these 10 KPIs every e-commerce store must track is not merely about data collection; it's about gaining a profound understanding of your business's operational health and strategic opportunities. Each metric offers a unique lens through which to view performance, from the efficiency of your marketing spend to the loyalty of your customer base. By diligently monitoring and analyzing these key indicators, e-commerce businesses can make data-driven decisions that foster sustainable growth, enhance profitability, and build lasting customer relationships. Want a quick read on how your store scores across these KPIs? Try the free Marketing Pulse Score Calculator — no signup required. And when you're ready for the full picture, try DawnPulse to get an AI-powered daily briefing with anomaly detection, trend analysis, and actionable recommendations.