Revenue · 15 min read · May 19, 2026
Stripe Revenue Intelligence: The SaaS Metrics That Predict Churn Before It Happens
MRR, churn rate, expansion revenue, and net revenue retention — this deep-dive explains what each metric signals, how to calculate them from Stripe exports, and which thresholds should trigger an alert.
Stripe Revenue Intelligence: The SaaS Metrics That Predict Churn Before It Happens
In the dynamic landscape of Software as a Service (SaaS), sustained growth hinges not just on acquiring new customers, but crucially, on retaining existing ones. Customer churn, the rate at which customers discontinue their subscriptions, represents a significant threat to revenue stability and long-term viability. Understanding and predicting churn before it impacts the bottom line is paramount for any SaaS business. This is where a robust approach to revenue intelligence, particularly leveraging platforms like Stripe, becomes indispensable. By meticulously tracking and analyzing key SaaS metrics, businesses can gain profound insights into customer health, identify early warning signs of dissatisfaction, and implement proactive strategies to mitigate churn.
Understanding Stripe Revenue Intelligence
Stripe, a leading financial infrastructure platform, processes billions in transactions annually, making it a rich source of granular revenue data for SaaS companies. Stripe Revenue Intelligence refers to the strategic utilization of this transactional data to derive actionable insights into business performance, customer behavior, and financial health. It moves beyond simple transaction reporting, enabling a deeper understanding of the underlying dynamics of your subscription business.
What is Stripe Revenue Intelligence?
At its core, Stripe Revenue Intelligence transforms raw payment data into meaningful business insights. It allows companies to track subscription lifecycles, identify payment failures, analyze pricing model effectiveness, and understand customer segments. When integrated with other critical business data sources—such as customer relationship management (CRM) systems, product usage analytics, and marketing platforms—Stripe data provides a holistic view of the customer journey and financial interactions. This comprehensive perspective is vital for identifying patterns that precede churn.
How it Integrates with Your Data
For SaaS businesses, the power of Stripe data is amplified when combined with information from other operational systems. Imagine correlating subscription changes from Stripe with user engagement data from your product, campaign performance from Meta Ads, or customer support interactions from Zendesk. This integration allows for a multi-dimensional analysis, revealing the true drivers behind customer behavior. Tools designed for daily briefings can ingest data from various sources, including Shopify, Google Analytics, Meta Ads, Stripe, Mailchimp, HubSpot, LinkedIn, X, WooCommerce, and Zendesk, to provide a unified view. This aggregated data forms the foundation for advanced analytics, including anomaly detection and trend analysis, which are critical for predicting churn.
Core SaaS Metrics for Churn Prediction
Predicting churn effectively requires a keen eye on specific financial and operational metrics. These metrics, often calculable directly from Stripe exports, serve as vital indicators of customer satisfaction and future retention. Mastering their calculation and interpretation is a cornerstone of proactive churn management.
Monthly Recurring Revenue (MRR)
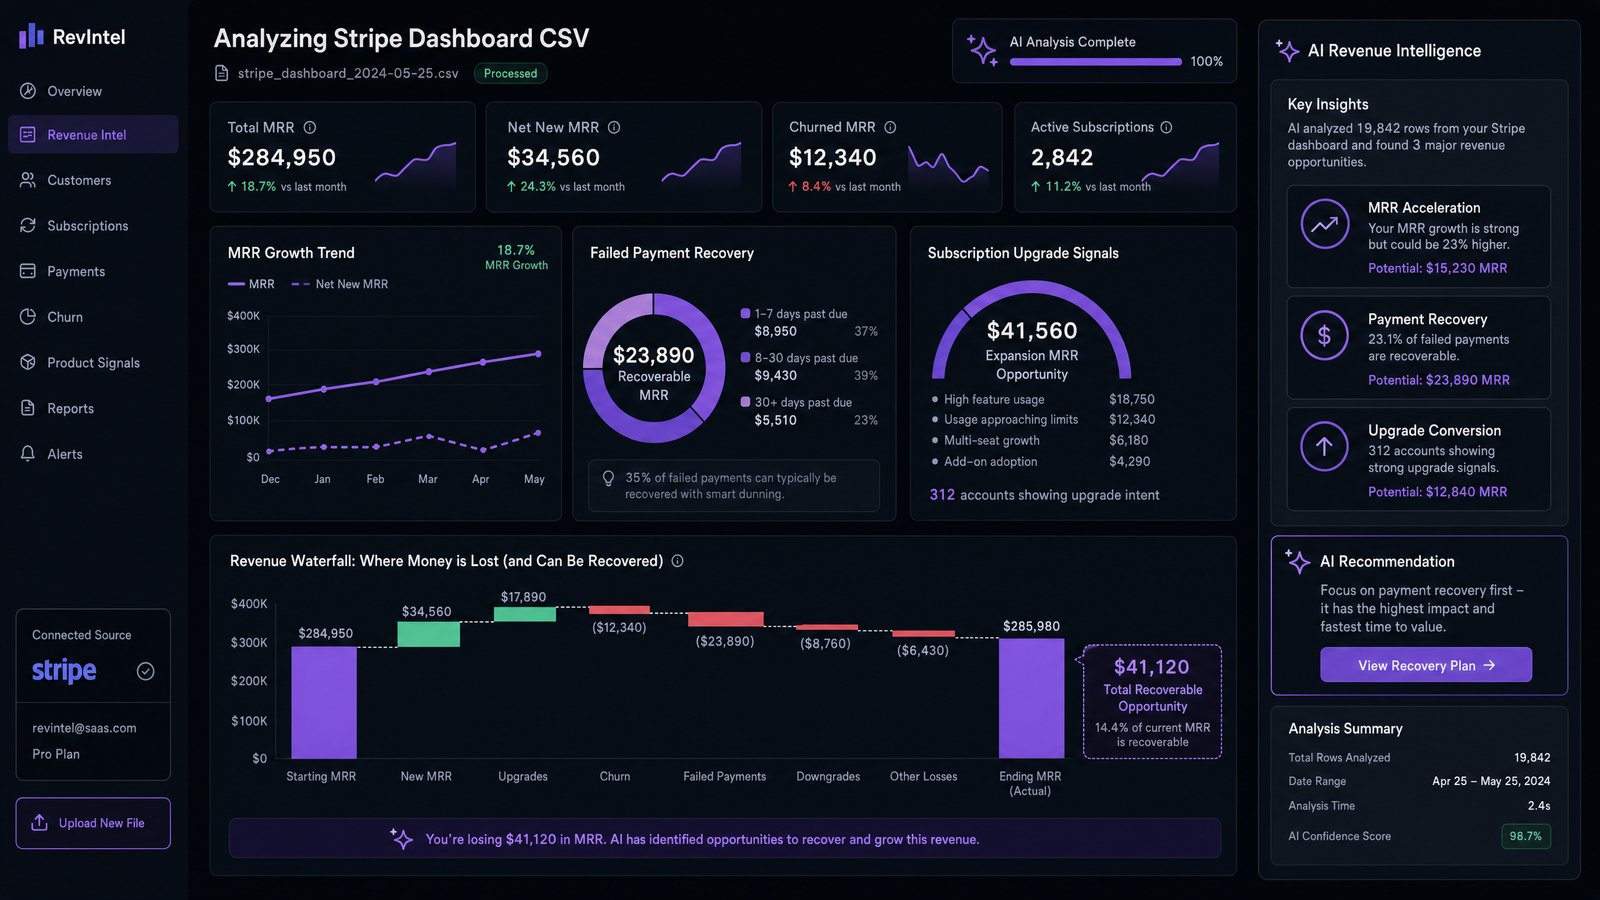
Monthly Recurring Revenue (MRR) is perhaps the most fundamental metric for any subscription business. It represents the predictable revenue a company expects to receive every month from its active subscriptions. MRR provides a clear snapshot of the business's financial health and growth trajectory. Fluctuations in MRR can signal underlying issues that may lead to churn.
Calculation from Stripe Exports: MRR can be calculated by summing the recurring revenue from all active subscriptions for a given month. Stripe provides detailed subscription data, including current plan, subscription start date, and recurring charges. You can export subscription reports and aggregate the monthly value of all active subscriptions.
What it Signals: A declining MRR trend, especially when not offset by new customer acquisition, is a strong indicator of potential churn or a struggling product-market fit. Conversely, consistent MRR growth suggests a healthy business. Analyzing MRR by customer segment can highlight which groups are contributing most to growth or decline.
Alert Thresholds: A sudden, unexplained dip in MRR, or a consistent negative growth rate over several months, should trigger an immediate investigation. For instance, a 5% month-over-month decline in MRR might warrant an alert, prompting a review of recent cancellations or downgrades.
Churn Rate (Customer and Revenue)
Churn Rate measures the percentage of customers or revenue lost over a specific period. It's crucial to distinguish between customer churn and revenue churn, as both offer different perspectives on business health.
Customer Churn Rate: The percentage of customers who cancel their subscriptions within a given period.
Calculation from Stripe Exports: Count the number of customers who canceled their subscriptions in a month and divide by the total number of customers at the beginning of that month. Stripe's subscription event data (e.g., customer.subscription.deleted) is invaluable here.
What it Signals: A high customer churn rate indicates a problem with customer satisfaction, product value, or onboarding. It suggests that customers are not finding sufficient value to continue their subscriptions.
Revenue Churn Rate: The percentage of recurring revenue lost from existing customers due to cancellations, downgrades, or failed payments within a given period.
Calculation from Stripe Exports: Sum the lost recurring revenue from cancellations and downgrades in a month, subtract any expansion revenue from existing customers (to get net revenue churn), and divide by the total recurring revenue at the beginning of the month. Stripe's invoice and subscription update events provide the necessary data.
What it Signals: Revenue churn is often a more impactful metric than customer churn, as losing a high-value customer has a greater financial impact than losing a low-value one. A high revenue churn rate, even with a stable customer count, points to issues with retaining high-tier customers or managing downgrades.
Alert Thresholds: Industry benchmarks vary, but a customer churn rate exceeding 5-7% monthly for B2B SaaS, or a positive revenue churn rate (meaning more revenue is lost than gained from existing customers), should trigger an alert. Monitoring these metrics closely allows for early intervention.
Expansion Revenue
Expansion Revenue is the additional revenue generated from existing customers through upsells, cross-sells, or increased usage of a usage-based pricing model. It's a powerful indicator of customer success and product value, demonstrating that customers are finding more value in your offering over time.
Calculation from Stripe Exports: Identify existing customers who have upgraded their plans or increased their usage, leading to higher recurring charges. Stripe's subscription update events (e.g., customer.subscription.updated) can show changes in subscription amounts. Sum the increase in MRR from these existing customers over a period.
What it Signals: Strong expansion revenue indicates a healthy customer base that is growing with your product. It suggests effective customer success initiatives, valuable new features, and opportunities for further growth. Low or negative expansion revenue, on the other hand, might signal that customers are not perceiving additional value or that upsell opportunities are being missed.
Alert Thresholds: A consistent decline in expansion revenue, or expansion revenue that is significantly lower than new business MRR, should raise a flag. Aim for expansion revenue to contribute a meaningful percentage to your overall MRR growth, ideally offsetting some or all of your gross churn.
Net Revenue Retention (NRR)
Net Revenue Retention (NRR), also known as Net Dollar Retention (NDR), is a comprehensive metric that measures the percentage of recurring revenue retained from an existing cohort of customers over a specific period, taking into account upgrades, downgrades, and churn. It's widely considered one of the most important metrics for SaaS businesses, as it reflects the true health and growth potential of the existing customer base.
Calculation from Stripe Exports: Start with the MRR from a cohort of customers at the beginning of a period. Add any expansion MRR from those same customers during the period. Subtract any churned MRR (from cancellations and downgrades) from those customers during the period. Divide this final amount by the initial MRR. Multiply by 100 to get a percentage. Stripe's detailed subscription history and invoice data are essential for this calculation.
What it Signals: An NRR above 100% is the gold standard, indicating that your existing customers are generating more revenue than they did previously, even after accounting for churn. This means your business can grow even without acquiring new customers. An NRR below 100% suggests that the revenue lost from churn and downgrades is greater than the revenue gained from expansion, signaling a significant challenge to sustainable growth.
Alert Thresholds: An NRR consistently below 100% is a critical alert, demanding immediate attention to customer retention and expansion strategies. Many successful SaaS companies aim for an NRR of 110% or higher, especially in mature markets. Any downward trend in NRR should be investigated promptly.
Leveraging Data for Proactive Churn Management
Simply calculating these metrics is only the first step. The true power lies in leveraging these insights for proactive churn management. This involves continuous monitoring, sophisticated analysis, and timely intervention.
Anomaly Detection and Trend Analysis
Modern revenue intelligence platforms go beyond static reporting by incorporating anomaly detection and trend analysis. Anomaly detection automatically flags unusual spikes or drops in metrics like MRR, churn rate, or expansion revenue that deviate significantly from historical patterns. This allows businesses to identify potential issues—or opportunities—before they escalate. Trend analysis, on the other hand, helps in understanding the long-term trajectory of these metrics, revealing whether changes are temporary fluctuations or part of a larger, more concerning pattern. For instance, a gradual but consistent increase in revenue churn over several months, even if not an immediate anomaly, is a critical trend to address.
Actionable Recommendations
The ultimate goal of Stripe Revenue Intelligence is to provide actionable recommendations. When an anomaly is detected or a negative trend emerges, the system should not just report the problem but also suggest potential causes and remedies. For example, if customer churn spikes in a particular segment, the recommendation might be to review recent product updates, re-engage with those customers through targeted campaigns, or enhance support resources. These recommendations transform data into strategic guidance, empowering teams to respond effectively and efficiently.
Conclusion
Mastering the SaaS metrics that predict churn before it happens is not merely good practice; it is a strategic imperative for sustainable growth. By deeply understanding and diligently tracking MRR, churn rate, expansion revenue, and Net Revenue Retention, businesses can gain unparalleled visibility into their customer base and financial health. Leveraging the rich data available through platforms like Stripe, and employing advanced analytics for anomaly detection and trend analysis, empowers companies to move from reactive damage control to proactive churn prevention. This data-driven approach ensures that potential issues are identified early, allowing for timely interventions that safeguard revenue and foster long-term customer loyalty. Want to pressure-test your numbers today? Try the free Blended ROAS Calculator, then start your free DawnPulse trial and upload your Stripe export to automate anomaly detection, trend analysis, and a daily briefing on the metrics that matter.