Technology · 7 min read · May 19, 2026
Your Zendesk Data Is a Product Roadmap: 6 Support Metrics That Reveal What to Build Next
Ticket volume by feature, resolution time trends, CSAT by product area — six Zendesk metrics that product and engineering teams should be reading every week to prioritise their backlog.
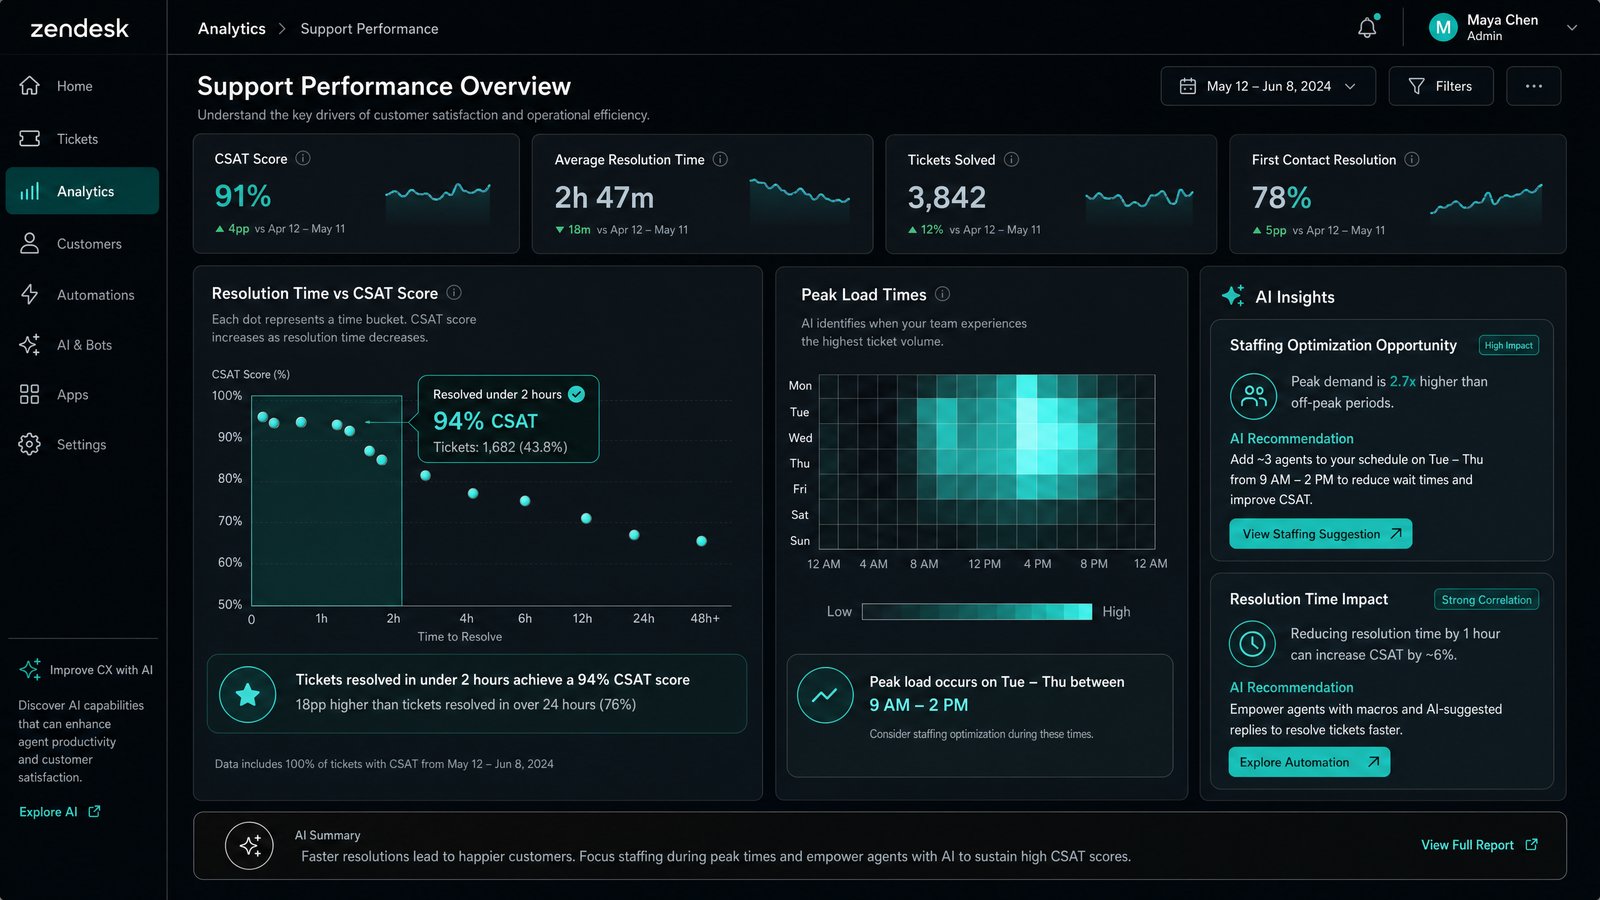
Your Zendesk Data Is a Product Roadmap: 6 Support Metrics That Reveal What to Build Next
In the dynamic landscape of product development, understanding customer needs is paramount. While product managers often rely on user research, market analysis, and competitive intelligence, a goldmine of actionable insights often remains underutilized: Zendesk customer support metrics. Your support data, far from being a mere operational report, can serve as a powerful product roadmap, revealing critical pain points, feature gaps, and opportunities for innovation. By systematically analyzing key metrics from your Zendesk instance, product and engineering teams can gain a data-driven edge in prioritizing their backlog and building products that truly resonate with users.
This article will delve into six essential Zendesk customer support metrics that, when regularly reviewed, can illuminate the path for future product enhancements and strategic development. These metrics move beyond superficial reporting, offering deep product insights that directly inform decision-making, foster customer success, and optimize resource allocation.
1. Ticket Volume by Feature/Product Area
One of the most straightforward yet impactful Zendesk customer support metrics is the volume of tickets associated with specific features or product areas. A surge in tickets related to a particular function often signals underlying issues, whether they are usability challenges, bugs, or unmet expectations. By categorizing and tagging support tickets effectively within Zendesk, product teams can quickly identify which parts of their product are generating the most friction for users.
Analyzing this metric over time can reveal trends. Is a newly launched feature experiencing an unexpectedly high volume of support requests? This could indicate a need for clearer documentation, an improved onboarding flow, or even a fundamental design flaw. Conversely, a consistently low volume of tickets for a critical feature might suggest it is robust and well-understood, freeing up development resources for other areas. This data is invaluable for backlog prioritization, allowing teams to address high-impact problems first.
2. First Response Time (FRT) and Resolution Time (RT) Trends
While primarily customer service metrics, First Response Time (FRT) and Resolution Time (RT) offer significant product insights when viewed through a product lens. Consistently high FRT or RT for specific types of issues or product areas can point to several product-related problems. For instance, if complex technical issues related to a particular integration consistently take longer to resolve, it might indicate a lack of self-service options, insufficient diagnostic tools within the product, or a need for better internal knowledge base articles that product teams can help create.
Tracking these trends helps identify areas where product improvements could empower support agents to resolve issues more quickly, thereby enhancing customer success. Faster resolution times often correlate with higher customer satisfaction. If agents are struggling to resolve issues efficiently due to product limitations, addressing those limitations becomes a high-priority item for the product roadmap. This metric also highlights opportunities for automation or AI-driven solutions within the product itself to deflect common support queries.
3. Customer Satisfaction (CSAT) by Product Area/Feature
Customer Satisfaction (CSAT) scores are a direct measure of how happy your users are, and when segmented by product area or feature, they become a potent source of product insights. A low CSAT score for a specific feature, even if ticket volume is moderate, indicates a deep-seated dissatisfaction that needs immediate attention. It suggests that while users might be able to use the feature, their experience is far from ideal.
This metric provides qualitative feedback that complements quantitative data. It helps product teams understand the emotional impact of their product on users. A low CSAT could stem from a confusing user interface, performance issues, or a feature that simply doesn't meet user expectations. By drilling down into the comments associated with low CSAT scores, product managers can uncover the root causes and translate them into actionable items for backlog prioritization, ensuring that improvements directly lead to improved customer success.
4. Escalation Rate by Issue Type
An escalation occurs when a support ticket cannot be resolved by the first-line agent and needs to be passed to a higher tier of support, often involving product specialists or engineers. The escalation rate, particularly when broken down by issue type or product area, is a critical Zendesk customer support metric for product teams. A high escalation rate for a particular problem indicates that the product either lacks clear solutions for that issue, or the issue itself is complex and requires specialized knowledge that isn't readily available to frontline support.
High escalation rates can be a drain on resources and a source of frustration for customers. From a product perspective, they highlight areas where the product might be too complex, prone to specific types of errors, or where self-service documentation is inadequate. Addressing these product gaps can significantly reduce the burden on higher-tier support and improve the overall customer experience. This metric is a clear signal for where to invest in product simplification or enhanced diagnostic capabilities.
5. Feature Request Volume and Trends
While not strictly a "problem" metric, tracking feature requests within Zendesk is an invaluable source of product insights. Many customers use support channels to suggest new functionalities or improvements to existing ones. By tagging these requests appropriately, product teams can quantify demand for specific features and identify emerging trends. A consistent stream of requests for a particular capability indicates a clear market need and a potential area for product expansion.
This metric helps validate product hypotheses and can directly influence backlog prioritization. It's not just about counting requests; it's about understanding the underlying user problems that these requests aim to solve. Combining feature request data with other Zendesk customer support metrics, such as CSAT or ticket volume, can provide a holistic view of user needs and guide strategic product development towards features that will genuinely drive customer success and competitive advantage.
6. Self-Service Usage vs. Direct Support Tickets
The ratio of self-service usage (e.g., knowledge base articles viewed, FAQ searches) to direct support tickets is a powerful indicator of your product's intuitiveness and the effectiveness of your self-help resources. If users are frequently resorting to direct support for common issues that are covered in your knowledge base, it suggests that either the knowledge base is difficult to navigate, the content is not easily discoverable, or the product itself is not intuitive enough to prevent these issues from arising.
This Zendesk customer support metric provides direct product insights into areas where user experience can be improved through better in-product guidance, clearer error messages, or more accessible self-help documentation. Product teams can work with support to identify gaps in self-service content or design product features that proactively guide users, reducing the need for direct intervention. Optimizing this ratio not only improves customer success by empowering users but also reduces operational costs for the support team.
Conclusion: Transform Support Data into Strategic Product Decisions
Your Zendesk instance is more than just a tool for managing customer queries; it's a rich repository of user feedback and behavioral data that can profoundly influence your product strategy. By diligently monitoring and analyzing these six Zendesk customer support metrics, product and engineering teams can move beyond reactive problem-solving to proactive, data-driven development. These metrics provide the necessary product insights to refine your roadmap, enhance existing features, and build new functionalities that truly address customer needs, ultimately driving customer success and business growth.
Don't let your valuable support data remain untapped. Start transforming your Zendesk customer support metrics into strategic product decisions today. To gain even deeper, AI-powered insights from your Zendesk data, upload a CSV or Excel export to DawnPulse — our platform delivers a daily briefing with anomaly detection, trend analysis, and actionable recommendations, helping you prioritize your backlog and accelerate your product development cycle. Start your free 14-day trial, or take the product showcase tour to see how it works first.